
What Homes Are Selling for in Upper Northwest DC Right Now: Q1 2026 Data
What are homes actually selling for in Upper Northwest DC in Q1 2026?
Median sale prices in Upper Northwest DC ranged from $1,700,000 to $2,435,000 between January and March 2026, with list prices averaging $839 per square foot — a modest softening from Q1 2025.
If you own a home in Spring Valley, Wesley Heights, AU Park, or Forest Hills and you’ve been watching the market, you already know that pricing here operates at a different scale than most of DC. What may surprise you is how much the numbers shifted month to month in Q1 2026 — and what that volatility actually signals for sellers.
Here’s what the MLS data shows.
Q1 2026 Median Sale Price: Month by Month
Let’s start with what the market accepted — closed sale prices:
| Month | Median Sale Price |
|---|---|
| January 2026 | $1,800,000 |
| February 2026 | $2,435,000 |
| March 2026 | $1,700,000 |
| Q1 2026 Average | ~$1,978,333 |
February’s $2,435,000 median stands out. That figure reflects a smaller pool of closed transactions — in a low-inventory market like Upper Northwest DC, a handful of higher-end closings can move the monthly median by hundreds of thousands of dollars. March’s return to $1,700,000 doesn’t signal a downturn; it reflects a different mix of properties closing that month. This is why a single month’s data should never be read in isolation.
Q1 2026 List Price Per Square Foot
Alongside sale price, list price per square foot tells you how sellers are entering the market:
| Month | List Price / Sq Ft |
|---|---|
| January 2026 | $827 |
| February 2026 | $821 |
| March 2026 | $868 |
| Q1 2026 Average | ~$839 |
March’s climb to $868/sqft — the strongest of the quarter — aligns with the seasonal pattern in Upper Northwest DC, where spring listings enter the market at higher asking prices. According to Bright MLS’s 2026 Mid-Atlantic Housing Market Outlook, spring activation in the DC metro typically begins accelerating in late February and peaks through April and May.
How Q1 2026 Compares to Q1 2025
Here’s the same data for Q1 2025:
| Month | Median Sale Price (2025) | List Price / Sq Ft (2025) |
|---|---|---|
| January 2025 | $2,300,000 | $897 |
| February 2025 | $1,631,250 | $851 |
| March 2025 | $2,140,000 | $795 |
| Q1 2025 Average | ~$2,023,750 | ~$848 |
Compared to Q1 2025, Q1 2026 shows:
- Median sale price down approximately 2.2% year over year ($1,978,333 vs. $2,023,750)
- List price per square foot down approximately 1% year over year ($839 vs. $848)
This is a modest softening — not a correction. The National Association of Realtors has noted that luxury and upper-tier markets in major metros are showing similar modest adjustments as elevated mortgage rates continue to shape buyer behavior. The more meaningful observation locally: March 2026 list price per square foot ($868) significantly outpaced March 2025 ($795), while March 2026 median sale price ($1,700,000) came in below March 2025 ($2,140,000). That divergence — sellers pricing more aggressively while fewer high-end transactions closed — is worth watching as Q2 data becomes available.
What the Full 2025 Seasonal Pattern Shows
Looking at all 12 months of 2025, the Upper Northwest DC median sale price ranged from $1,569,000 (September) to $2,400,000 (April), with a full-year average of approximately $1,906,102. The seasonal pattern is clear:
- Spring peak (April): Median sale price $2,400,000
- Summer softening: August–September median drops to $1,685,000–$1,569,000
- Fall recovery: October–December median climbs back to $1,870,000–$1,914,470
For sellers, this reinforces a consistent message: spring and early fall are when Upper Northwest DC buyers are most active and transactions at the upper end of the market are most likely to close at strong prices.
What This Means If You’re Pricing Your Home
These figures are a market-wide snapshot. What matters for your specific home is how it compares within that range — and that depends on factors the data alone can’t capture.
Price Per Square Foot Is a Starting Point, Not a Formula
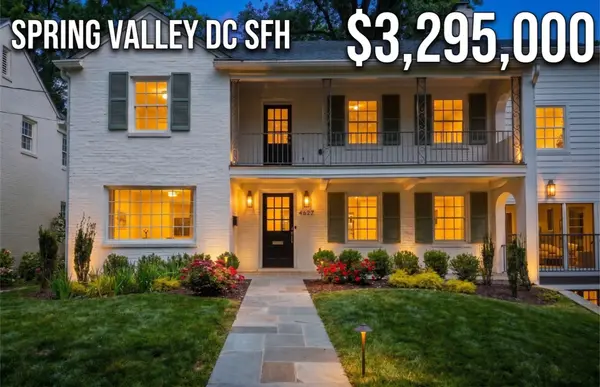
At $839/sqft on average, a 3,500 square foot home in Spring Valley would carry a list price around $2.9M as a rough baseline. But finish level, lot size, garage configuration, and renovation recency all move the actual number in meaningful ways. A recently updated kitchen and primary suite in this market isn’t a luxury — it’s table stakes for achieving the upper end of the per-square-foot range.
With my interior design background (NCIDQ, CID, ASID), I evaluate every listing through both a market lens and a design lens. That combination lets me identify which improvements will move the needle on pricing — and which won’t recoup their cost before closing.
List Price and Sale Price Are Not the Same
The per-square-foot figures above reflect list prices — what sellers asked. The median sale price figures reflect what actually closed. In a well-priced listing in Upper Northwest DC, those numbers should track closely. According to Redfin’s Northwest Washington DC market data, sale-to-list ratios in DC’s upper-tier neighborhoods have remained strong, though properties with extended days on market tend to see larger gaps between ask and close price.
Low Transaction Volume Creates Volatility
February’s $2,435,000 median versus March’s $1,700,000 median — a $735,000 swing in a single quarter — illustrates how thin monthly transaction volume can distort the numbers. Upper Northwest DC is not a high-volume market. This is why I work from rolling 90-day comps rather than single-month data when advising sellers on pricing strategy.
Frequently Asked Questions
What is the median home sale price in Upper Northwest DC in Q1 2026?
Based on MLS closed sales data, the Q1 2026 median sale price averaged approximately $1,978,333 — ranging from $1,700,000 in March to $2,435,000 in February. Month-to-month swings in this range reflect low transaction volume rather than market instability.
How does the Upper Northwest DC market in Q1 2026 compare to Q1 2025?
Median sale prices declined approximately 2.2% year over year, from ~$2,023,750 in Q1 2025 to ~$1,978,333 in Q1 2026. List price per square foot also softened modestly, from $848 to $839. This represents a slight adjustment, not a correction.
What is the price per square foot in Upper Northwest DC in 2026?
The average list price per square foot in Upper Northwest DC in Q1 2026 was $839, rising to $868 in March as spring listings entered the market at higher asking prices.
When is the best time to sell a home in Upper Northwest DC?
Based on 2025 full-year MLS data, spring is consistently the strongest season. The April 2025 median sale price reached $2,400,000 — the annual peak. Summer months soften, with September hitting the annual low at $1,569,000. Early fall shows recovery, making April and October–November the strongest windows for sellers.
Why do home prices vary so much month to month in Upper Northwest DC?
Upper Northwest DC is a low-volume luxury market. A small number of high-end closings in any given month can move the median by hundreds of thousands of dollars. Pricing decisions should be based on rolling 90-day comparable sales rather than any single month’s data.
If you’re thinking about selling in Upper Northwest DC — whether in Georgetown, Bethesda, or anywhere along the Chevy Chase corridor — I’d love to talk through what the market looks like for your specific home. Call or text me directly at 202.536.4043, or visit sherinemonir.com to get started. — Sherine on Your Side
Recent Posts